 Air and greenhouse gas emissions from cruise ships and other maritime activity sources that the Port has influence but not direct control over are inventoried every five years through the Puget Sound Maritime Air Emissions Inventory (PSEI). Data is available for 2005, 2011, and 2016. The next update to the PSEI is underway now.
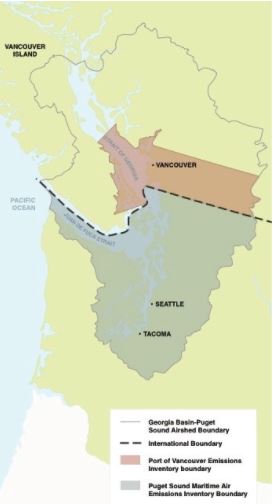
The PSEI quantifies emissions for cruise ships and other types of oceangoing vessels for the portion of the vessel’s journey through the Puget Sound airshed, which extends from a vessel’s berth in Seattle to the Canadian border and the mouth of the Strait of Juan de Fuca (see gray-shaded area in map). This focus on emissions within the airshed is consistent with port emissions inventory guidance developed by the U.S. Environmental Protection Agency.
The PSEI does not include all emissions associated with the cruise industry, such as passenger travel to and from the ship, supplies for each ship, or shoreside waste disposal; and it does not cover the full round-trip journey from Seattle to Alaska. Additionally, other maritime-related emissions sources are limited to port authority activities, and do not include emissions from all marine transportation sources, such as Washington State Ferries, the U.S. Coast Guard, private companies, and others.
| Maritime Source | 2016 Greenhouse Gas Emissions (Metric Tons CO2 equivalent) | 2016 Diesel Particulate Matter Emissions (Metric Tons DPM) |
|---|---|---|
| Marine cargo ships | 106,042 | 33 |
| Trucks | 79,642 | 21 |
| Cruise ships | 53,625 | 19 |
| Rail locomotives | 23,097 | 9 |
| Cargo-handling equipment | 14,446 | 5 |
| Harbor vessels | 11,229 | 6 |
| Recreational vessels | 6,700 | 0.3 |
| Grain ships | 4,912 | 1 |
| Light-duty vehicle fleet | 420 | .01 |
| Total | 300,113 | 94 |
Data source: 2016 Puget Sound Maritime Air Emissions Inventory (totals include Port of Seattle and the Northwest Seaport Alliance marine cargo operations in Seattle and are converted from short tons to metric tons)
For comparison, the GHG emissions generated by the City of Seattle are 5,766,042 tonnes annually, according to the 2018 GHG Inventory (includes GHG emissions from building energy use, transportation energy use (air, marine, passenger cars, trucks), and waste).