May 27, 2026
The Northwest Seaport Alliance (NWSA or the alliance) is one of the top container ports in North America. Cargo operations through the Seattle and Tacoma gateway have a significant impact on international trade and the local economy, providing jobs and revenue to Washington state — one of the most trade-dependent states in the country.
The NWSA produces an annual cargo trade report that highlights trade activity, including country, port, and commodity breakdowns, as well as profiles on the top 10 trading partners by total 20-foot equivalent units (TEUs).
- View the 2025 Annual Cargo Trade Report
- View monthly volume data and past annual cargo trade reports
- 2023 Economic Impact
In 2025, the top trading partners by TEUs were:
1. China
2. Japan
3. Vietnam
4. South Korea
5. Taiwan
6. Thailand
7. Indonesia
8. Malaysia
9. India
10. The Philippines (+1)
When ranked by vessel value, the top trading partners were:
1. Japan (+1)
2. China (-1)
3. South Korea
4. Vietnam
5. Taiwan
6. Thailand
7. Indonesia
8. Australia (+1)
9. Cambodia (+3)
10. Malaysia (-2)
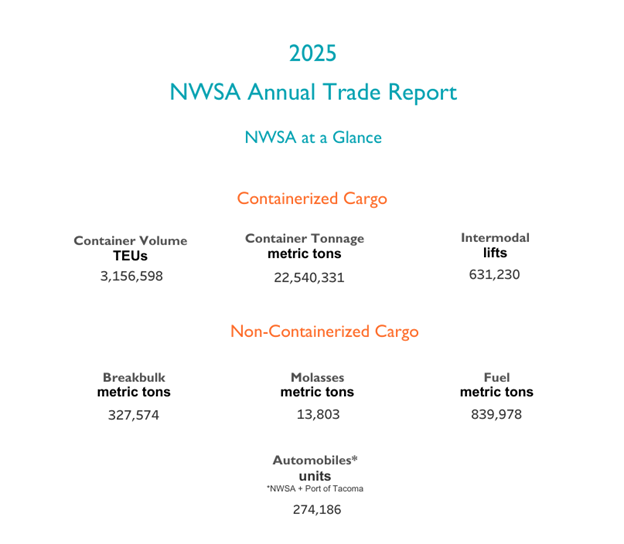
NWSA 2025 volumes at a glance
TEUs
NWSA handled 3.2 million 20-foot equivalent units (TEUs) in 2025, down 5.5% from 2024’s 3.3 million TEUs. Strong import shipments in anticipation of tariffs and uncertainty related to Canadian longshore and rail labor contract negotiations contributed to strong volumes in 2024.
Global reach
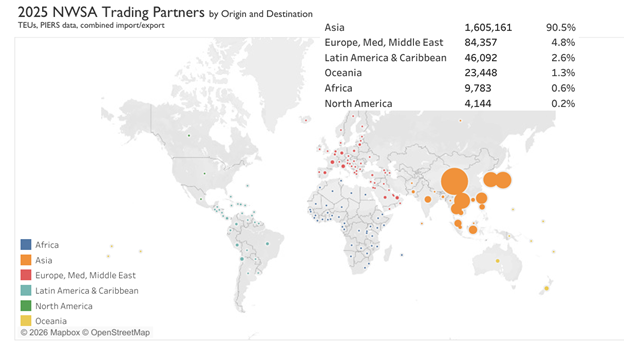
NWSA has regular weekly services with key markets in Asia, Europe, Latin America, and Oceania, and the products from our region reach markets all over the world. Asia made up most of the volume through the NWSA gateway, accounting for 90.5% of trade by TEUs in 2025.
Strong trade relationships
Washington state is one of the most trade-dependent states in the nation and has established strong trade relationships with many other countries. These top countries import and export valuable merchandise and commodities through the NWSA gateway.
| Rank | Container Volume, Foreign Full TEUs (Source: PIERS) | By Vessel Value US$ (Source: WISER) | ||
|---|---|---|---|---|
| Country | Foreign Full TEUs | Country | Vessel Value | |
| 1 | China | 593,002 | Japan | $14,520.2M |
| 2 | Japan | 221,660 | China | $14,457.6M |
| 3 | Vietnam | 203,206 | South Korea | $9,623.4M |
| 4 | South Korea | 180,768 | Vietnam | $8,650.7M |
| 5 | Taiwan | 100,712 | Taiwan | $3,720.4M |
| 6 | Thailand | 94,812 | Thailand | $2,399.4M |
| 7 | Indonesia | 55,859 | Indonesia | $1,501.1M |
| 8 | Malaysia | 40,736 | Australia | $1,164.4M |
| 9 | India | 34,203 | Cambodia | $1,065.4M |
| 10 | Philippines | 23,637 | Malaysia | $1,025.2M |
| 11 | Cambodia | 17,981 | India | $1,016.4M |
| 12 | New Zealand | 12,999 | Philippines | $884.7M |
| 13 | Hong Kong | 11,492 | Germany | $591.7M |
| 14 | Australia | 10,168 | Brazil | $552.2M |
| 15 | France | 10,072 | New Zealand | $445.6M |
| 16 | Italy | 9,703 | Bangladesh | $435.5M |
| 17 | Singapore | 9,565 | Singapore | $429.6M |
| 18 | Chile | 9,321 | Italy | $399.2M |
| 19 | United Arab Emirates | 8,212 | Canada | $289.7M |
| 20 | Pakistan | 7,215 | Hong Kong | $280.7M |
Top five import trading partners by TEUs
1. China — 525,280 TEUs
2. Vietnam — 179,127 TEUs
3. Japan — 82,972 TEUs
4. South Korea — 81,278 TEUs
5. Thailand (+1) —65,669 TEUs
Fun fact: Southeast Asia is a growing market via our gateway.
Top five export trading partners by TEUs
1. Japan — 138,689 TEUs
2. South Korea (+1) — 99,490 TEUs
3. China (-1) — 67,722 TEUs
4. Taiwan — 49,831 TEUs
5. Thailand — 29,143 TEUs
Fun fact: Frozen potato products (French fries) remain a top commodity to Japan, our number one export destination by TEUs and vessel value.
Reaching the world
The following global ports send and receive the highest volume of cargo handled by the NWSA.
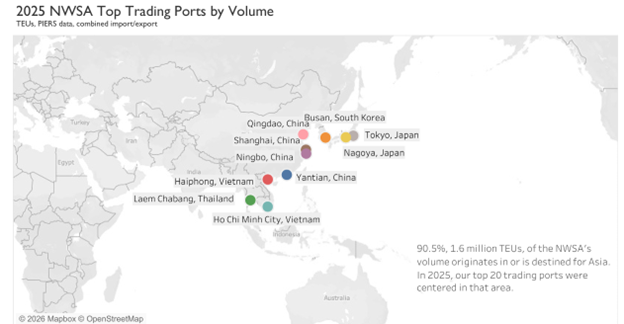
Top five origin ports by TEUs:
1. Yantian, China — 139,406 TEUs
2. Shanghai, China — 121,139 TEUs
3. Ningbo, China — 110,844 TEUs
4. Ho Chi Minh City, Vietnam – 86,129 TEUs
5. Busan, South Korea — 79,463 TEUs
Fun fact: Shanghai is the largest port in the world by TEUs.
Top five destination ports by TEUs:
1. Tokyo, Japan — 16,326 TEUs
2. Busan, South Korea — 14,511 TEUs
3. Gwangyang, South Korea — 11,652 TEUs
4. Hong Kong — 9,273 TEUs
5. Kobe, Japan — 7,185 TEUs
Fun fact: Two of the top five destination ports are in Japan, which is our number one export country by TEUs and vessel value.
Top five commodities
Here are the types of commodities moved through NWSA container terminals in 2025 by TEUs and vessel value.
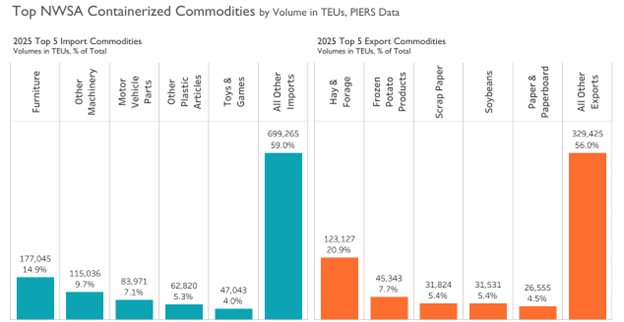
Above: Bar chart comparing NWSA’s top containerized import and export commodities in 2025. Key imports include furniture, machinery, motor vehicle parts, plastics, toys, and a large ‘all other imports’ category. Key exports include hay and forage, frozen potato products, scrap paper, soybeans, paper and paperboard, and a large ‘all other exports’ category.
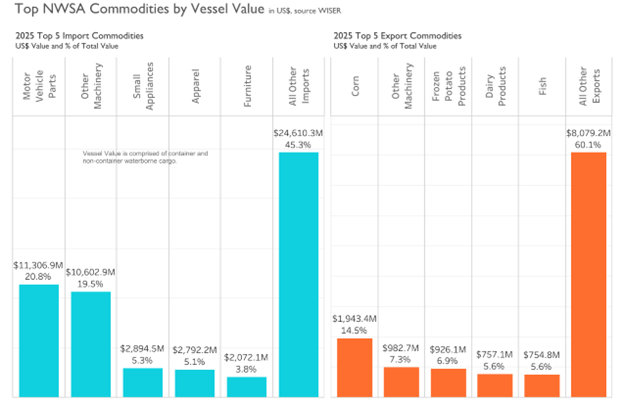
Above: Bar chart showing NWSA’s top 2025 import and export commodities by vessel value. Leading import categories include motor vehicle parts, machinery, small appliances, apparel, furniture, and a large ‘all other imports’ category. Leading export categories include corn, machinery, frozen potato products, dairy products, fish, and a large ‘all other exports’ category.
Export gateway of choice
The NWSA is the leading U.S. export gateway for the following by TEUs:
- hay and forage
- frozen potato products (French fries)
- Washington state is the number two U.S. producer of potatoes
- apples
- Washington state is the number one U.S. producer of apples
- legumes: peas, beans, and lentils
- Washington state is the number three U.S. producer of lentils
- fresh potatoes
- Washington state is the number two U.S. producer of potatoes
- grass feed
- hops and hop extract
- Washington state is the number one U.S. producer of hops
- cherries
- Washington state is the number one U.S. producer of sweet cherries
In addition, the NWSA is the nation’s second-largest gateway for containerized refrigerated (reefer) exports. Top reefer exports include:
- Frozen potato products (French fries)
- apples
- fish
- fresh potatoes
- pork
- dairy products
- vegetables
- beef
Gateway to Alaska and Hawaii
While most cargo is international, the NWSA is also the gateway to Alaska and Hawaii, with four domestic carriers providing regular weekly services. In 2025, 23.4% of cargo was domestic. NWSA domestic terminals handle more than 80% of containerized ocean shipments between Alaska and the lower 48 states.
Washington agriculture
As has been noted in past posts, agricultural products are a huge part of the NWSA’s export volumes. The Port of Seattle recognizes that our state would never be an agricultural leader without the contributions of migrant farm workers and partners.
- Meet some of those leaders in the film Trabajo: On their Shoulders
The Washington State Department of Agriculture produces graphics that tell the story well.
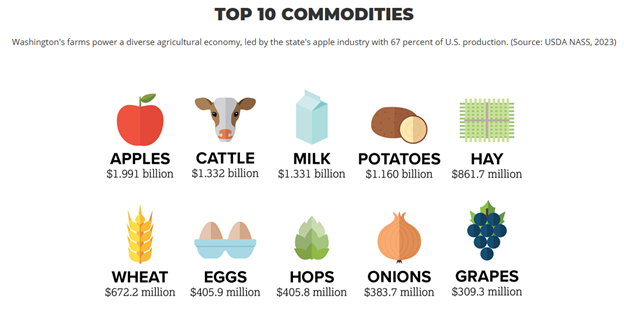
Source: Washington State Department of Agriculture
Washington state is a top producer for many agricultural commodities:
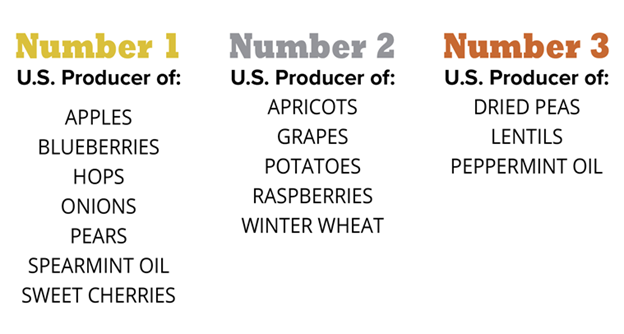
Source: Washington State Department of Agriculture
Breakbulk and autos
The NWSA provides a range of services like shipping breakbulk, project cargo, heavy lift cargo, and autos — including helicopters — with regularly scheduled services to and from Asia, Europe, and Oceania, and by transshipment to anywhere in the world.
In 2025, auto units finished down 18.8%, as high interest rates and inflation muted car sales. Breakbulk metric tons were down 18.7%. High interest rates took a toll on agricultural, mining, and construction equipment sales.
If you are a watcher of Seattle’s working waterfront, you may have noticed auto vessels calling at Terminal 46. View recent operations.
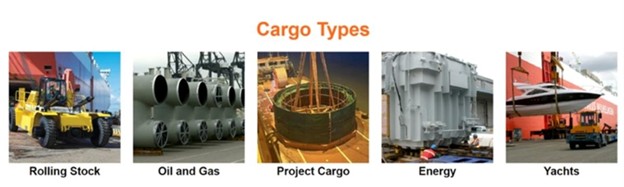
Above: Infographic showing five types of cargo handled: rolling stock, oil and gas equipment, project cargo, energy‑related equipment, and yachts, each illustrated with a representative photo.
Vessel calls
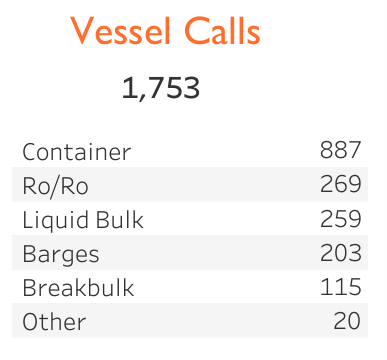
Fun fact: The largest vessel handled in the gateway is the 17,859 TEU CMA CGM Benjamin Franklin, which called at Terminal 18 in the Seattle Harbor in 2016.
Summary
- 3.2 million TEUs carried 22.5 million metric tons of containerized cargo in 2025
- Most of this cargo was international, but 738,064 TEUs were shipped to and from Alaska and Hawaii
- Domestic terminals handle more than 80% of containerized shipments between Alaska and the lower 48 states
- Thirteen international container carriers provide regular weekly services to key markets in Asia, Europe, Latin America, and Oceania
- Thirteen regularly scheduled liner services connect cargo to over 40 direct international ports of call
- Seven breakbulk and roll on /roll off carriers offer regular service through Puget Sound with service to markets around the globe
- Four domestic carriers provide regular weekly services to Alaska and Hawaii
- A study released in 2025 highlighted NWSA’s economic impact: 52,105 total jobs supported, $4.4 billion in total employee compensation, and $14 billion in total business output
- 40% of the jobs in Washington state are tied to trade
Follow us
About The Northwest Seaport Alliance
The Northwest Seaport Alliance is a marine cargo operating partnership between the Port of Seattle and Port of Tacoma and a leading container gateway in North America. Under a port development authority, the NWSA manages the container, breakbulk, auto, and some bulk terminals in Seattle and Tacoma.