May 4, 2022
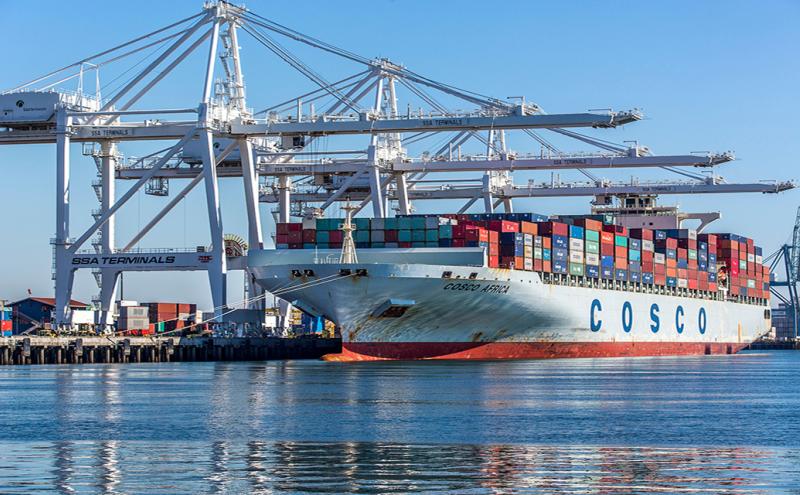
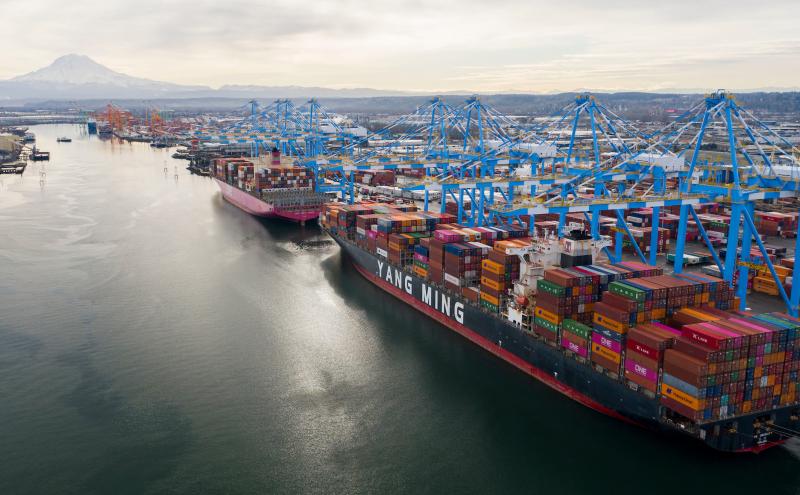
As one of the largest container gateways in the U.S. and a key transport hub, marine cargo handled through The Northwest Seaport Alliance (NWSA) terminals has a significant impact on both international trade and the local economy. Curious to learn about our key trade relationships that keep cargo moving through our terminals and what gets loaded on the vessels, trucks, and trains?
The NWSA is a marine cargo operating partnership of the ports of Tacoma and Seattle. The NWSA produces an annual trade report, and the 2021 NWSA Annual Cargo Trade Report is now available online! The report highlights trade activity and includes country, port, and commodity breakdowns, as well as profiles on the top 10 trading partners by total TEU, which are China, Japan, South Korea, Vietnam, Taiwan, Thailand, Indonesia, Malaysia, Philippines, and India.
Here’s an executive summary of what’s coming and going from the seaport at a glance:
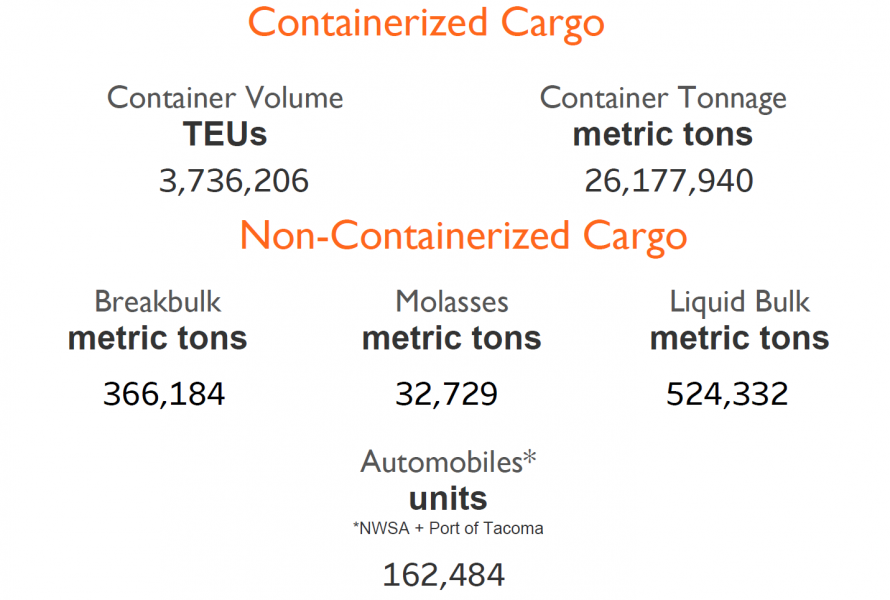
The Northwest Seaport Alliance handled 3.74 million twenty-foot equivalent units (TEUs) in 2021, an increase of 12.5% from 2020's 3.32 million TEUs. Coming out of the pandemic, the increase was driven by strong consumer demand and the need to restock inventory.
Did you know? A TEU is a metric for measuring cargo volumes, and really means a shipping container — the kind you see all the time on trucks, trains, and ships.
Hot commodities
Commodities are raw materials or products that are traded and are referred to as cargo when they are transported. Here are the types of commodities moved through the container gateways in Seattle and Tacoma in 2021.
Top 5 import commodities by TEUs
- Furniture — 241,412 TEUs
- Other machinery — 128,802 TEUs
- Motor vehicle parts — 94,456 TEUs
- Toys and games — 81,024 TEUs
- Other plastic articles — 67,455 TEUs
Top 5 export commodities by TEUs
- Hay and forage — 157,182 TEUs
- Frozen potato products — 53,711 TEUs
- Paper and paperboard — 37,573 TEUs
- Wood pulp 31,166 — TEUs
- Other foodstuffs — 26,640 TEUs
Global commerce
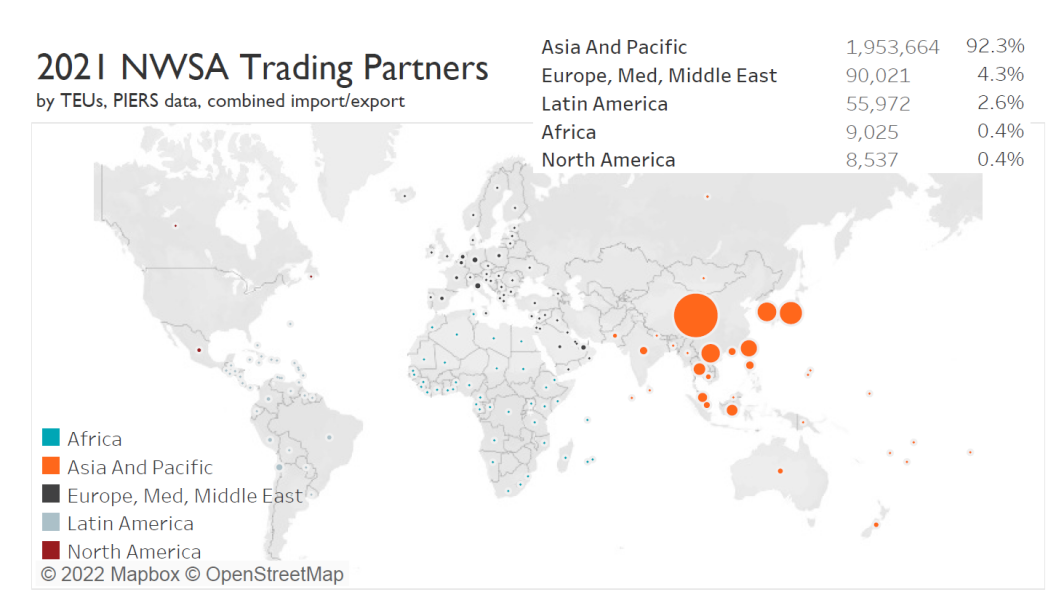
The products from our region reach markets all over the world, with weekly services to (and from) Europe, Central and South America, and Oceania. Asia and the Pacific make up the vast majority of trade volume in the Pacific Northwest, with 92.3% of trade by volume.
Strong trade relationships
The Pacific Northwest is one of the most trade dependent states in the nation and has established strong trade relationships with many other countries. These top five countries import and export valuable merchandise and commodities through the NWSA gateway.
Top 5 import trading partners by TEUs
- China — 820,939 TEUS
- Vietnam — 147,313 TEUs
- Japan — 82,993 TEUs
- Taiwan — 73,391 TEUs
- South Korea — 67,784 TEUs
Fun Fact: In 2017, Vietnam was the fifth largest source of goods to our region through the NWSA
Top 5 export trading partners by TEUs
- Japan — 159,223 TEUs
- China — 122,594 TEUs
- South Korea — 104,185 TEUs
- Taiwan — 55,399 TEUs
- Indonesia — 27,214 TEUs
Fun Fact: In 2017, Indonesia was NWSA’s seventh largest destination country.
Reaching the PNW and the world
The following global ports send and receive the highest volume of cargo handled by NWSA.
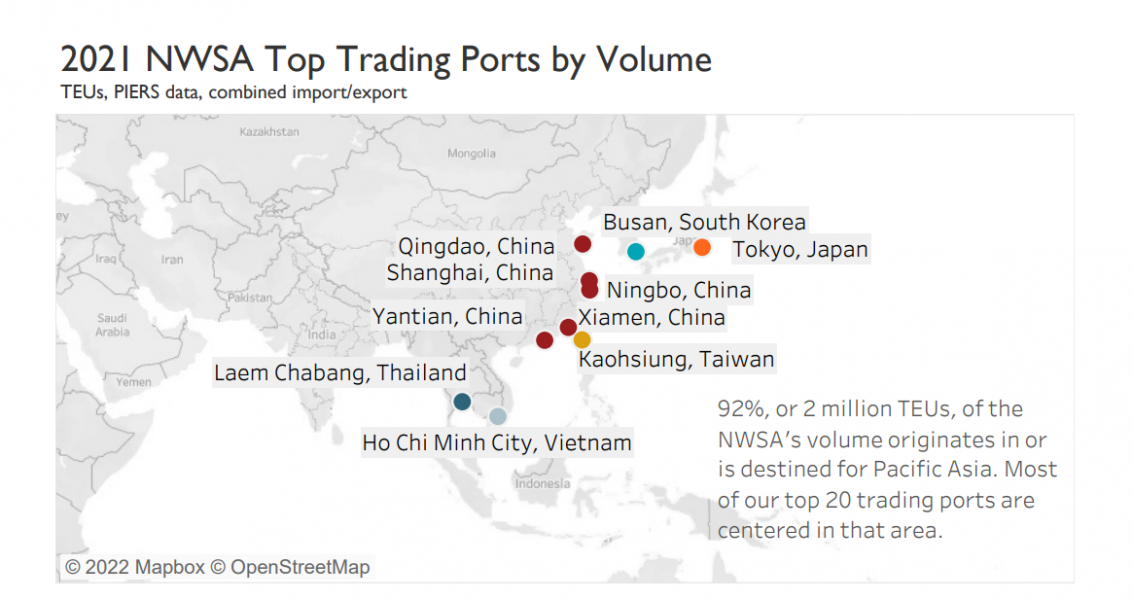
Origin ports by TEUs
- Yantian, China — 247,516 TEUs
- Shanghai, China — 237,437 TEUs
- Ningbo, China — 108,225 TEUs
- Ho Chi Minh City, Vietnam — 75,854 TEUs
- Qingdao, China — 70,729 TEUs
Destination ports by TEUs
- Tokyo, Japan — 59,644 TEUs
- Gwangyang, South Korea — 51,246 TEUs
- Kaohsiung, Taiwan — 46,943 TEUs
- Busan, South Korea — 43,064 TEUs
- Qingdao, China — 29,600 TEUs