November 8, 2021
By William Walker, intern in the Office of Equity, Diversity, and Inclusion
The Port of Seattle’s Equity Index, developed by the Office of Equity Diversity and Inclusion’s Alison Beason, is a game changer. Alison Beason is the EDI Senior Data and Policy analyst who previously made mappings of inequity for the City of Tacoma. I had the opportunity to speak to Beason about the project, and the ways that it can be used to advance equality in King County.
Intesectionality is defined as
“an analytical framework for understanding how aspects of a person's social and political identities combine to create different modes of discrimination and privilege. Intersectionality identifies multiple factors of advantage and disadvantage. Examples of these factors include gender, caste, sex, race, class, sexuality, religion, disability, physical appearance, and height. These intersecting and overlapping social identities may be both empowering and oppressing." (Source: Wikipedia)
A community tool
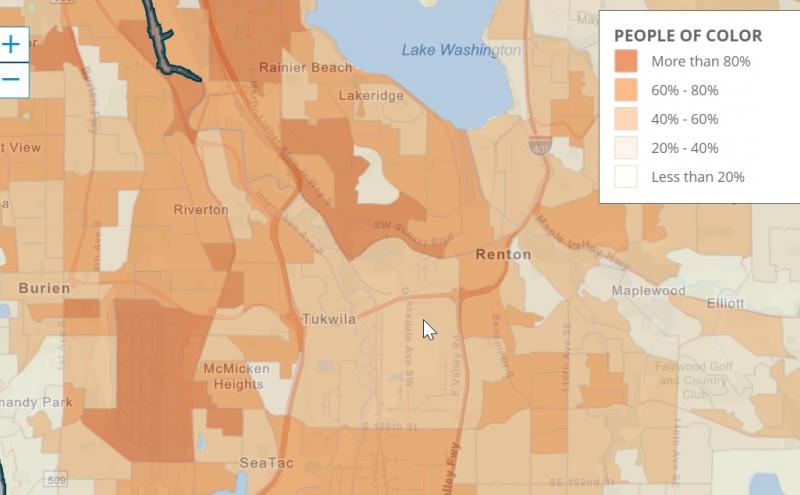
What is the equity index? As explained on the Port website, it is an interactive map that shows environmental and social disparities in King County. It uses 21 indicators to judge the “equity” of an area, based around economy, livability, accessibility, and environment.
Beason emphasized how this program is open to public use, including individuals, non-profits, and community organizers. This easy to use and map-based tool is imperative for organizations that might be adept at gathering quantitative data, but not qualitative data. The raw GIS data is also available to use.
Pushing back against the racialization of data
Beason emphasized how it's important for mapping tools like this to make clear that the poor living conditions that people of color might be living in isn’t because of the community's race, but the social systems around them.
“So often with equity mapping, people use race as a negative data point. As a Black woman I don’t think my race and gender are a negative data point. It isn’t that my life isn’t as good as others because of my race, gender, and location — it is because society has surrounded me with bad transportation, bad streets, and predatory higher interest loans. It’s not that these identities make the standard of living negative; it is the limitations placed on these communities by society.”
Beason also spoke to how data visualization itself can propagate/support/ racial stereotypes. “There is also color association — red or black are usually associated with bad parts of town and bad aspects of data." Negative associations between the color black and less desirable neighborhoods is especially problematic considering how areas with predominant communities of color are portrayed negatively.
The future of the equity index
Beason emphasized how she wishes for the index to not only be a measure of inequity now, but a tool for change in the future. The equity index can be used as a baseline to view improvement — and hopefully see the effects of investments by the Port of Seattle and other organizations.
Subscribe to Equity in Action for updates on these topics