
April 22, 2020
For communities and ports to work together towards environmental equity, the starting place is recognizing and using the right data. In honor of Earth Day’s 50th Anniversary, the Port’s Office of Equity, Diversity, and Inclusion announces its design of an Environmental Equity Map, forthcoming this spring. The Port recognizes that pollution, access to economic opportunity, and health, vary across the region. This map will be a visualization and ranking of environmental burden and social vulnerability across census tracts in King County and will provide the Port with a systematic method to visualize that variability so that we can implement evidence-based strategies for how to direct resources towards the areas of greatest need.
An Earth Day achievement for everyone
Before the first Earth Day was celebrated in 1970, indigenous people and communities of color long championed environmental protections and the sustainable use of natural resources, despite their experiences with discrimination and bearing a disproportionate burden of environmental harms. Widespread participation in the first Earth Day helped generate the political support needed to pass landmark environmental laws including the Clean Air Act, the Clean Water Act, and the National Environmental Protection Act, and established the Environmental Protection Agency. In recent years, however, the environmental movement has transformed into the modern, inclusive, and equitable Climate Justice movement, which traces its principles in Environmental Justice, a dialogue that centers those most impacted by the cumulative impacts of environmental degradation and discrimination. In this way, governments, companies, non-profits, and individuals can more effectively address climate change in a way that benefits all human life, no matter your race, income, or background. Over the past few years, the Port of Seattle has been able to use environmental health data to partner with our most impacted communities.
Using data in partnership with communities
For example, here in King County, we can see how disproportionate environmental burdens exacerbate the socioeconomic barriers experienced by a community, which leads to significant negative impacts in people’s life expectancy. In 2013, the Cumulative Health Impacts Analysis (CHIA) was co-authored by Just Health Action and the Duwamish River Cleanup Coalition. The CHIA found that a range of health exposures and impacts disproportionately affect people in the Duwamish Valley, an area with the greatest number of contaminated waste sites, poorly built environment characteristics, and severe air pollution compared to the rest of Seattle. Life expectancy in the neighborhoods of Georgetown and South Park is up to 13 years shorter than wealthier and less diverse parts of the city. With the use of this data, the Port and the Duwamish Valley community worked together to establish Resolution 3767, the Duwamish Valley Community Benefits Commitment. This policy is the first at a US port authority that commits the port to partnering with a community to address climate justice issues through the Duwamish Valley Community Equity Program. This partnership, benefiting both the Port and the community, was made possible through the collection of good data and a strong, collaborative analysis on how to use data to solve some of our region’s most urgent disparities.
Expanding knowledge and tools for county-wide impact
With the launch of the county-wide Environmental Equity Map this spring, the Port joins many regional and national government efforts to recognize existing environmental inequities and take these disparities into consideration when making decisions. Washington State agencies like the Department of Health and the Department of Natural Resources have both begun using equity tools in grant application criteria, while both King County and the City of Seattle incorporated an equity framework into their decision making.
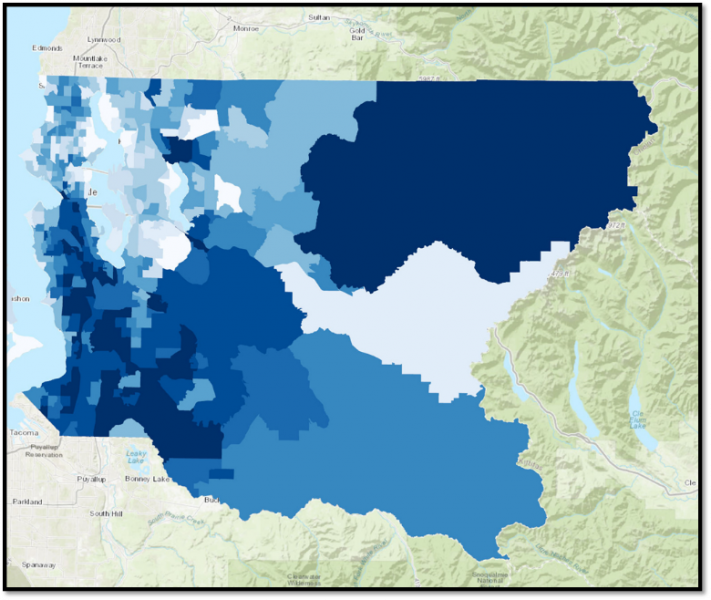
The Port’s map will display individual and composite environmental health and social indicators ranked 1-10. The map will allow you to see how a census tract ranks for each indicator, for each of the four indicator categories, and for all indicators together as a composite. The map leverages indicators and methodology from the statewide Environmental Health Disparities Map. Additionally, the map leverages indicators included in the King County Determinants of Equity Report, and the Puget Sound Regional Council Opportunity Map. The indicators included are listed below:
| Sensitive Populations | Socioeconomic Status |
|---|---|
| Access to Healthy Food | Access to Living Wage Jobs |
| Diabetes Related Mortality | Foreign Born Populations |
| Cardiovascular Disease | Home Ownership Rates |
| Low Birth Weight | Housing Burden |
| Job Growth | |
| Linguistic Isolation | |
| Low Educational Attainment | |
| Poverty | |
| Transportation Expense | |
| Unemployment |
| Environmental Exposure | Environmental Effects |
|---|---|
| Diesel Emissions | Lead Risk and Exposures |
| Ozone | Proximity to Hazardous Waste Generators and Facilities |
| Proximity to Parks/Open Spaces | Proximity to Superfund Sites |
| Particulate Matter 2.5 | Proximity to Facilities with Highly Toxic Substances |
| Toxic Release from Facilities | Wastewater Discharge |
| Traffic Density | |
| Tree Canopy/Tree Inventory |
The composite scores are based on scientific understandings of compounding burdens. This is the idea that environmental burdens don’t just impact lives as singular factors, rather, they combine to significantly exacerbate health and socioeconomic factors. For example, as we see in the Duwamish Valley, low income communities and communities of color are more exposed to poor air quality, and therefore experience higher rates of asthma. Heightened rates of cardiovascular disease and diabetes are also more prevalent. These factors combined with socioeconomic barriers like diminished access to quality health care or limited English proficiency create significant obstacles when health or financial hardships hit. These realities are observable today; the spread of COVID-19 has demonstrated that historic and present day discrimination make it harder for communities of color to stay afloat in a health and financial crisis, when compared to other communities who don’t experience these barriers.
“The Port recognizes the impacts of environmental inequities on our region’s most vulnerable populations and the role that industrialization has played in perpetuating these disparities. Moving forward, the aim of this map is to support the Port’s efforts to better leverage data in our policy making and improve our community engagement to ensure the Port’s mission equitably serves all of King County,” said Bookda Gheisar, Senior Director of the Office of Equity, Diversity, and Inclusion.