As hubs of transportation activity, ports move people and goods using vehicles, vessels, equipment, buildings, and facilities that are mostly powered by fossil fuels. These energy-intensive operations contribute to air pollutant and GHG emissions in the region. Port of Seattle is part of a region-wide inventory to measure and track maritime-related air pollutant and GHG emissions. The Puget Sound Maritime Air Emissions Inventory is conducted every five years by the Puget Sound Maritime Air Forum, a voluntary association of private and public maritime organizations, ports, air agencies, environmental and public health advocacy groups and other parties with operational or regulatory responsibilities related to the maritime industry.
About the Inventory
The Puget Sound Maritime Air Emissions Inventory (PSEI) covers air pollutant and greenhouse gas (GHG) emissions from all maritime-related activities in the U.S. portion of Puget Sound. Information about levels of air pollutants and GHG emissions is summarized for each inventory year for the Puget Sound region, by county, and by participating port. Emissions are modeled based on vessel or equipment details, like engine size and fuel type, operational profiles, and activity data for each sector.
The PSEI is conducted only every five years and involves collecting data from ports, port tenants, customers, and industries within the maritime supply chain. Inventory data is available for 2005, the baseline year, 2011, 2016, and, 2021.
2021 Puget Sound Air Emissions Inventory (published June 6, 2024):
- Volume 1: Region-Wide Results & Methodology
- Volume 2 Results by Port
- Regional Summary Two-Pager
- Port of Seattle Summary Two-Pager
Previous PSEI Reports: 2005, 2011, 2016
| Ports | Port of Anacortes in Skagit County; Port of Everett in Snohomish County; Port of Port Angeles in Clallam County; Port of Olympia in Thurston County; Port of Seattle in King County; Port of Tacoma in Pierce County; The Northwest Seaport Alliance (NWSA), including NWSA North Harbor in King County and NWSA South Harbor in Pierce County |
|---|---|
| Sectors | Ocean-going vessels; commercial and recreational harbor vessels; cargo-handling equipment; rail locomotives; heavy-duty vehicles (container trucks, cruise shuttle buses); fleet vehicles |
| Pollutants | Carbon monoxide (CO); nitrogen oxides (NOx); sulfur dioxides (SO2), volatile organic compounds (VOC); fine particulate matter (PM2.5); GHG emissions (measured in the PSEI as carbon dioxide equivalents (CO2e)); diesel particulate matter (DPM); black carbon (BC) |
Maritime Emission Trends
The results of the 2021 PSEI indicate the Puget Sound airshed experienced a substantial reduction in air pollution from maritime and seaport-related emissions since the first PSEI in 2005 and a modest reduction in GHG emissions. GHG emissions continue to fluctuate with levels of activity (e.g., vessel traffic and cargo volumes). While newer, cleaner equipment, vehicles, and vessels are more fuel efficient, a large-scale transition away from fossil fuels is needed to drive deep reductions in GHG emissions toward climate goals.
- Puget Sound Region: ↓82% diesel particulate matter (DPM), ↓10% GHG compared to 2005
- Port of Seattle: ↓88% DPM, ↓26% GHG compared to 2005, however trends impacted by shortened cruise season in 2021
Oceangoing vessels continue to be the largest contributor to maritime-related emissions in the airshed. Supply chain disruptions from the COVID-19 pandemic in 2021 led to more cargo ships at anchor in Puget Sound than usual and increased time at berth, impacting emission trends.
Cruise ships experienced reduced operations in 2021 as the industry returned from the pandemic-induced shutdown in 2020. As a result, Port of Seattle’s emission trends for 2021 do not reflect a normal year of operations. Cruise calls decreased by more than 50 percent; however, activities to restart operations increased time at anchor and at berth where ships continue to run their engines
Drivers of region-wide emission trends:
- Turnover to newer, cleaner vessels, cargo-handling equipment, and vehicles that reduce both DPM and GHG emissions with higher pollution controls and enhanced fuel efficiency. For example, 48 percent of cargo-handling equipment in the region uses Tier 3 or Tier 4 diesel engines compared to 0 percent in 2005.
- The North American Emissions Control Area went into effect in 2015, and mandates use of fuels with 0.1 percent sulfur content (or equivalent through use of exhaust gas cleaning systems) within 200 nautical miles of the U.S. Coast. DPM from oceangoing vessels declined 91 percent in 2021 compared to 2005.
- Implementation of the NWSA Clean Truck program, which went into effect in 2019 and requires all drayage trucks servicing international container terminals to use model year 2007 or newer engines and meet emission control standards that reduce DPM up to 90 percent per truck. DPM from heavy-duty vehicles across the region declined 93 percent in 2021 compared to 2005.
- Shore power connection in the region increased significantly, from 42 calls connecting across Puget Sound berths in 2005 to 132 calls in 2021.
Drivers of Port of Seattle emission trends:
- The shortened cruise season in 2021 impacted cruise emissions and related operations, such as cruise buses and heavy-duty vehicles that serve cruise terminals: The Port saw a 39 percent reduction in revenue cruise calls from 2005, and a 67 percent reduction in cruise passengers from 2005.
- The North American Emissions Control area reduced DPM emissions for oceangoing vessels (cruise and grain ships at Port of Seattle).
- Fluctuations in port activity with increased harbor vessel activity and decreased rail locomotive activity.
- Turnover to newer, cleaner recreational vessels.
- Turnover to newer, cleaner, and more fuel-efficient terminal equipment: 90 percent of terminal equipment at Port of Seattle meets Tier 4 interim or equivalent emission standards, including 40 percent which are powered by electricity.
How is Port of Seattle Reducing Maritime Emissions?
Results from the PSEI help guide and focus the Port’s emissions reduction efforts. Much of the progress ports and industry have made reducing emissions can be attributed to changes in regulations, industry action, and port policies and programs to accelerate the turnover of older equipment and use cleaner fuels. Since 2008, the Port has collaborated with Port of Tacoma, Northwest Seaport Alliance, and Vancouver Fraser Port Authority in British Columbia on the Northwest Ports Clean Air Strategy, a joint effort to reduce maritime-related air and GHG emissions in the ports' shared airshed. The four ports announced a renewed 2020 Northwest Ports Clean Air Strategy that sets a bold new vision to phase out seaport related emissions by 2050. Port of Seattle developed a Maritime Climate and Air Action Plan that sets out strategies and actions to reduce emissions through 2030.
Explore the Data
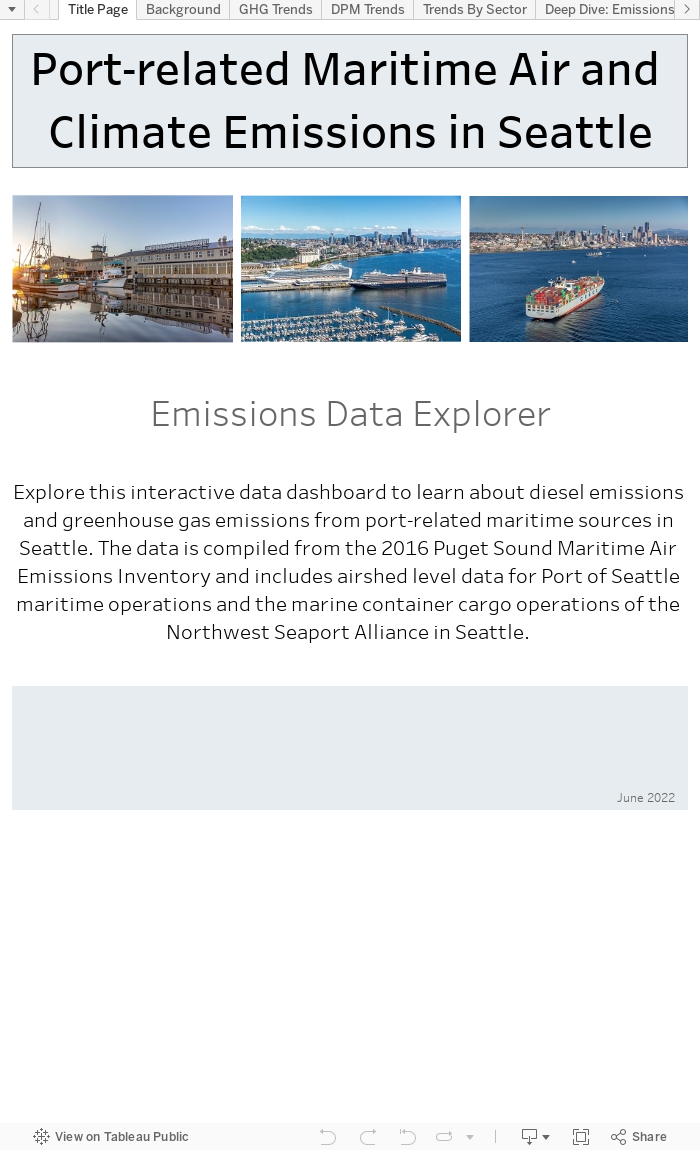
This interactive data dashboard can be used to explore emissions data from the 2016 Puget Sound Maritime Air Emissions Inventory. Please note that the tool has not yet been updated to include the 2021 PSEI results.
It summarizes and visualizes airshed-level data for DPM and GHG emissions from Port of Seattle maritime operations and the marine container cargo operations of the Northwest Seaport Alliance in Seattle. The Port of Seattle’s lines of business include the cruise, grain, commercial fishing, recreational boating, and other maritime industries. In addition, the Port of Seattle is a partner in The Northwest Seaport Alliance (NWSA) a separate port development authority that operates container cargo terminals in Elliott Bay. NWSA North Harbor emission sources include container ships, cargo-handling equipment used on container terminals, container trucks, and locomotives. Looking at both Port of Seattle and NWSA North Harbor gives a more complete picture of maritime emissions from Seattle-based ports.
Click through the tabs to explore the different visualizations available. Use the filters to look at data for specific maritime activities or filter to focus on a specific port organization. Please email [email protected] with any questions or to provide feedback on the tool.
More detail on trends for other air pollutants and other ports is available in the full 2016 PSEI report.