April 26, 2021
By Elise Lasky, Washington Sea Grant Hershman Fellow
Greenhouse gas emissions (GHGs) are invisible gases in the atmosphere that absorb and trap heat. The use of fossil fuels — like gasoline, diesel, coal, and natural gas, deforestation, and other human activities — have increased the concentration of GHGs in the atmosphere and contributed to global warming. If left unchecked, climate change will have devastating effects both globally and locally. What is more, the adverse impacts are more likely to be borne by historically marginalized communities, including Black, Indigenous, and people of color (BIPOC), who already experience health disparities and are disproportionately exposed to environmental hazards. To avoid the most extreme impacts of climate change, the International Panel on Climate Change (IPCC) has determined that global temperature increase must be limited to 1.5 degrees Celsius (°C) above pre‐industrial levels.
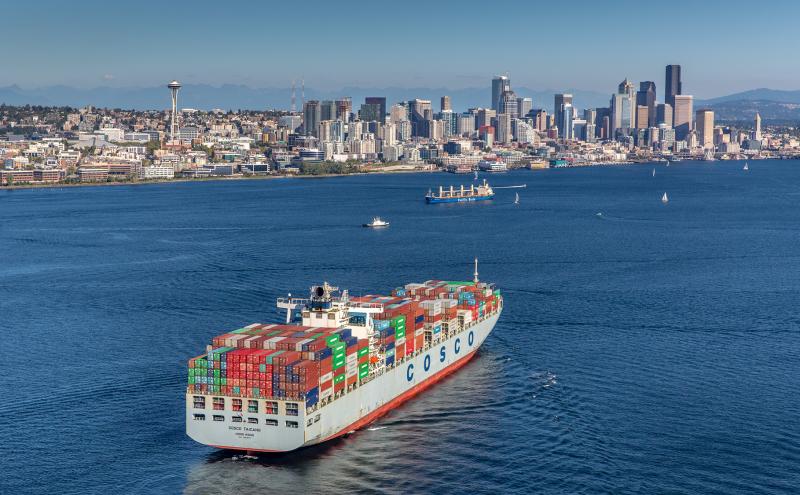
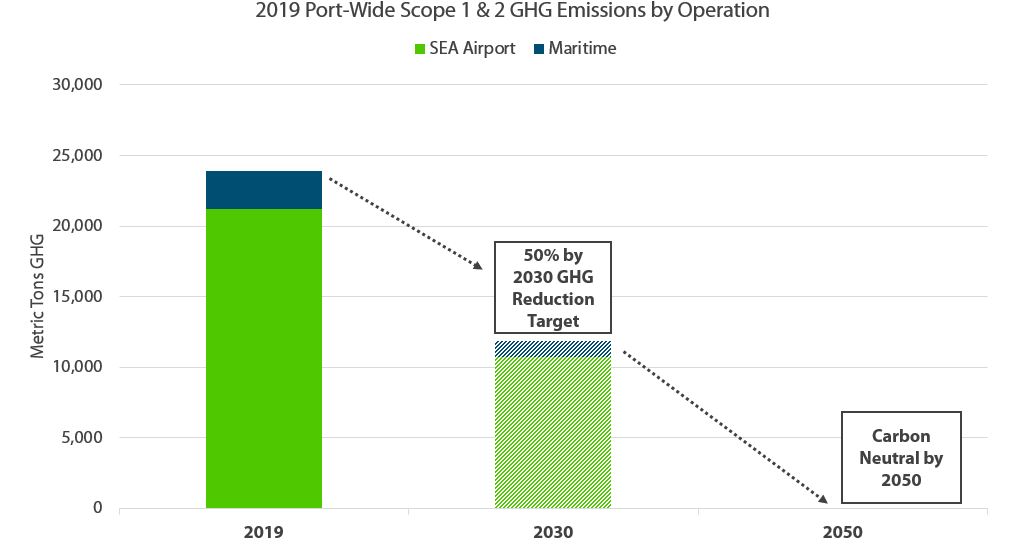
The Port of Seattle is acutely aware of the far-reaching impacts that climate change is having on the region today and is planning for the future. As part of its ambitious Century Agenda, the Port has a long-range commitment to reduce emissions from port-owned or controlled sources by 50 percent by 2030, and to be carbon neutral or carbon negative by 2050. From investing in renewable natural gas at Seattle-Tacoma International Airport (SEA ) to using shore power to reduce emissions from cruise ships at berth, the Port is working to fulfill its responsibility to address climate change.
How will the Port track progress towards GHG emissions goals?
The Port conducts two separate GHG emissions inventories:
- GHG emissions associated with SEA Airport
- GHG emissions from maritime sources like large ships burning fossil fuels
A GHG emissions inventory lists sources of GHG emissions and quantifies the amount of GHGs discharged into the atmosphere over a certain time period using a standardized method. The Port of Seattle uses The Greenhouse Gas Protocol: A Corporate Accounting and Reporting Standard (GHG Protocol Corporate Standard) to quantify its emissions. The Port began conducting GHG inventories in 2006 for SEA Airport, and recently added a Maritime GHG Emissions Inventory. Both of these inventories together document the Port’s total contribution to GHG emissions. Port staff collaborate to ensure emissions aren’t double counted between the Aviation and Maritime inventories.
What are the sources of GHG emissions?
Most GHG emissions in the atmosphere are released through the burning of fossil fuels, such as diesel and gasoline used in passenger cars or trucks, natural gas used to heat and cool buildings, jet fuel used in airlines, and marine diesel oil used in ships. The Port of Seattle is a leader in moving people and cargo across the country and around the world:
- SEA Airport is the eighth busiest airport in the country (pre-COVID)
- More than one million passengers embarked on a cruise journey through Seattle before COVID-19
- 13 percent of the total U.S. commercial fishing harvest is caught by vessels that move through the Port’s commercial marinas
All of these industries contribute to the regional economy, but also rely on fossil-based fuels that generate GHG emissions. Even the Port’s internal operations contribute to GHG emissions in the energy used to light, heat, and cool buildings; power fleet vehicles and equipment; fuel used in employee commutes; and solid waste disposal practices.
The Port’s level of control over addressing emissions from these sources varies by the source of emissions, so its GHG reduction targets and inventories separate emissions by level of control, which is referred to by scope.
Scope 1 SourcesDirect Emissions from sources within the Port's control |
Scope 2 SourcesIndirect emissions produced to generate the electricity used by the Port |
Scope 3 SourcesEmissions the Port has influence over, but not direct control over |
|---|---|---|
|
|
|
What is tracked in an inventory?
The Port conducts GHG emissions inventories annually for the previous calendar year. The process to develop a GHG emission inventory can be complex and involves compiling a lot of data from many sources. For example, Port staff calculate the gallons of diesel and gasoline used in fleet vehicles from records of fuel dispensed at port-owned fueling stations, fuel purchased on fueling cards, and mileage reimbursements made to employees traveling in their own vehicles for port business.
Information is collected annually where possible, including for mobile fossil fuel use, building energy use, and solid waste. The Port can’t always compile annual data for all emissions sources, particularly for Scope 3 sources where data comes from external partners. Where data is not available for a particular year, more recent information is considered a representative or “proxy” for that year. For example, emissions from oceangoing vessels, commercial harbor vessels, recreational vessels, locomotives, cargo-handling equipment, and cruise buses on terminals are quantified every five years through the Puget Sound Maritime Air Emissions Inventory. The latest GHG emissions data for these sources is for 2016, so the 2016 levels of GHG emissions are used in the 2019 Maritime Scope 3 GHG Emissions Inventory and will continue to be used for the 2020 Inventory. The next Puget Sound Maritime Air Emissions Inventory will be conducted for year 2021. In other cases, available data is scaled to approximate energy use or emissions in a particular year, such as scaling an airline’s fuel use based on the number of operations flow that year.
Energy source x emissions factor = GHG emissions
Information collected for each energy source — such as liquid fuels, electricity, and natural gas use — are calculated into GHG emissions by multiplying each source by a specific emissions factor. An emissions factor relates that energy use or activity with an associated release of GHG emissions into the atmosphere. The Port uses verified emissions factors compiled by the U.S. Environmental Protection Agency (EPA) and The Climate Registry and documents each emissions factor annually as they can change year to year.
The Port is committed to data accuracy and transparency and the inventories represent a best estimate of emissions sources. As new information or inventory best practices become available the Port may choose to update historical data or inventory methods to better reflect its sources and their contributions.
How will the Port reduce its GHG emissions?
Emissions inventories are an essential tool to help the Port identify where and how to reduce emissions. Strategies to reduce emissions rely on partnerships with port tenants, industry, service providers, and community members. Here are just a few of the many examples of emissions reduction initiatives at Port maritime and airport facilities:
 |
|
|---|---|
|
Renewable Natural Gas:
Greener Transportation Options:
Sustainable Aviation Fuels:
|
Shore Power:
Solar Pilot Projects:
|
Track GHG emission reduction progress at Measuring Greenhouse Emissions