July 5, 2022
By Ryann Child, Environmental Program Manager, Maritime Environment & Sustainability
From the Northwest Ports Clean Air Strategy vision to phase out emissions from seaport-related activities by 2050 to accelerating organization-wide greenhouse gas (GHG) reduction targets, the Port of Seattle has made bold commitments to address seaport-related air pollution and take action on climate change.
With a clear ambition and plans like Charting the Course to Zero: Port of Seattle’s Maritime Climate and Air Action Plan in place to guide action, the question remains — how will we track and report on our progress?
That’s where regular inventorying of air and GHG emissions is critical. This year, the Port and other public and private entities across the Puget Sound Region that include the ports of Anacortes, Everett, Olympia, Port Angeles, Tacoma, and the Northwest Seaport Alliance, private industry associations, and government agencies, will update the Puget Sound Maritime Air Emissions Inventory, a study that estimates emissions from port and other maritime activities in the Puget Sound airshed. Conducted every five years, it is a foundational element of the Port’s clean air and climate programs that allows us to identify major sources of climate and air pollution and track emission trends and progress over time. To date, Puget Sound Maritime Air Emissions Inventory studies have been conducted in 2005, 2011, and 2016. This next Inventory will look at emission levels during 2021. The regional study, which will be completed in 2023, complements the Port’s annual process to collect and analyze GHG emissions data from Port-owned sources.
What can the Inventory tell us about air quality or climate change?
The Puget Sound Maritime Air Emissions Inventory provides critical data for tracking air pollutant and GHG emission trends over time and understanding the distribution of emissions across the different “sectors” of maritime activity (discussed in more detail below). The results inform the Port’s air quality and climate programs in several ways:
- Identify the biggest maritime-related contributors to air pollution and GHG emissions and target actions to reduce emissions from these sources
- Track airshed-level and sector-specific (e.g., emissions from trucks or cruise ships) emission trends over time to measure progress
- Better understand how port and maritime related sources contribute to air pollution and GHG emissions in the region
It’s also important to note that the Inventory can’t answer all of our questions. For example, it does not tell us about air quality in real-time. The Inventory estimates emissions from a given source (or several sources) of emissions in a given area over time. In this way, an emissions inventory provides detail on where emissions are coming from. This information can then be used to target action and predict the potential impact of an emission reduction action on air quality. Finally, the Puget Sound Maritime Emissions Inventory measures tailpipe emissions, or emissions released at the time of combustion or when fuel is burned. It does not estimate lifecycle emissions or fugitive emissions that result from the extraction, processing, or transport of fossil fuels or technology. Port of Seattle and the other Northwest Ports have made a commitment under the Northwest Ports Clean Air Strategy to better understand lifecycle GHG emissions in port operations.
What does the Inventory cover?
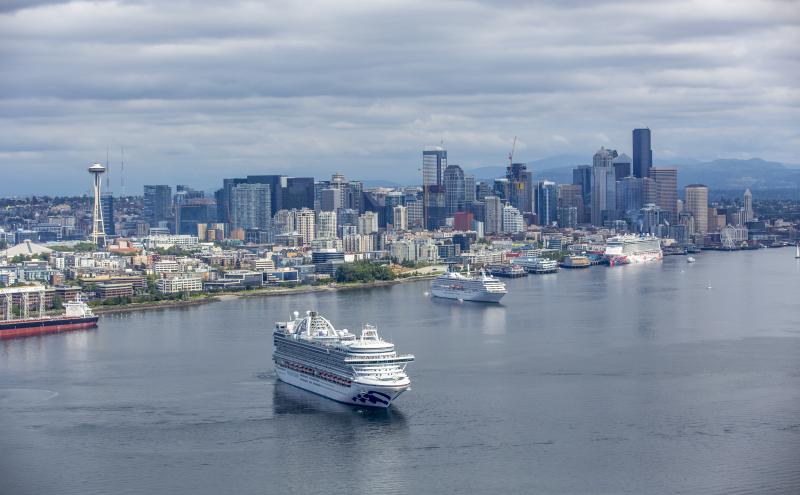
The Inventory includes both port-related sources (e.g., cruise ships, container ships, drayage trucks) and other non-port related (e.g., Washington State Ferries) mobile sources of maritime emissions. These sources are organized into six “sectors” of maritime activity, as shown below.
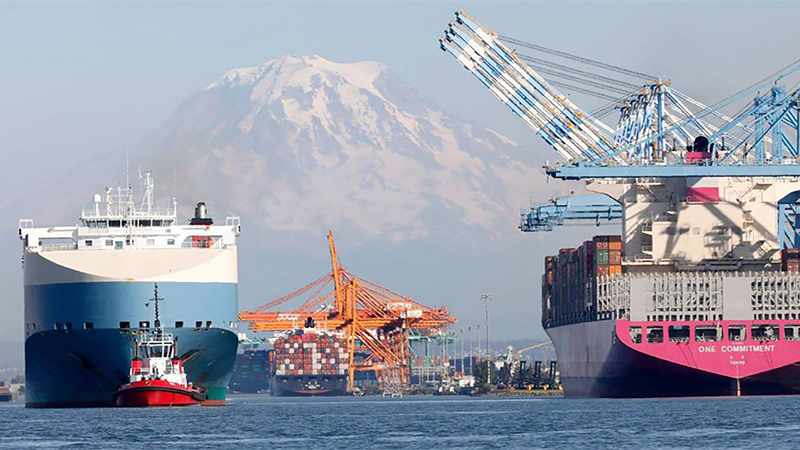
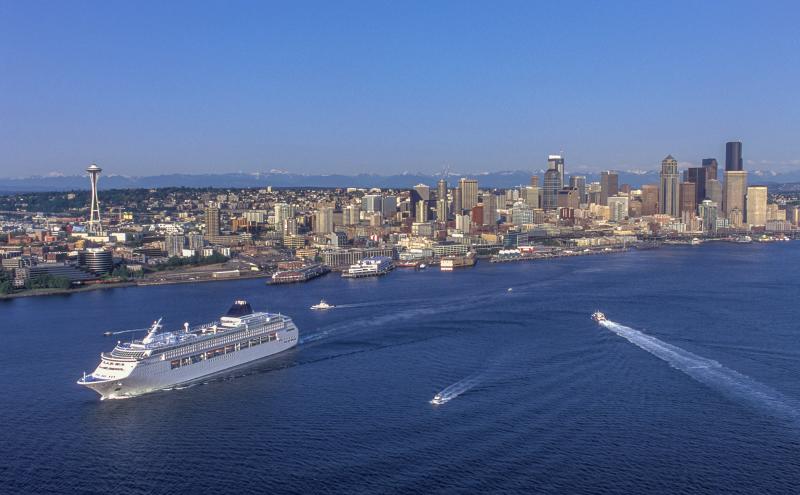
Oceangoing vessels: |
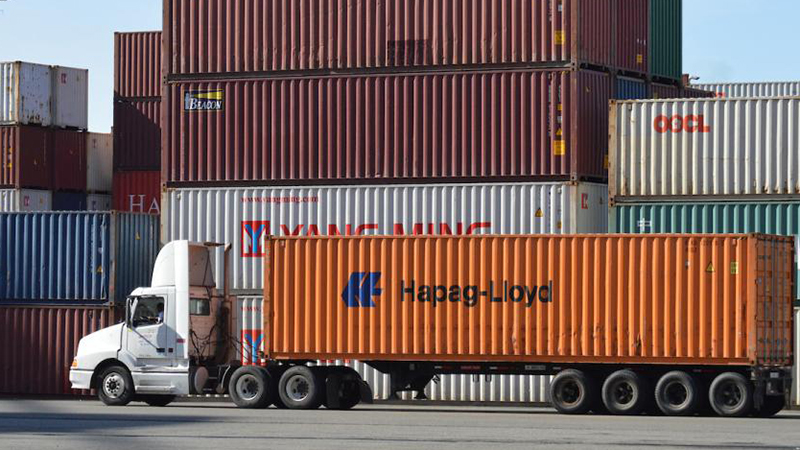
Heavy-duty vehicles: |
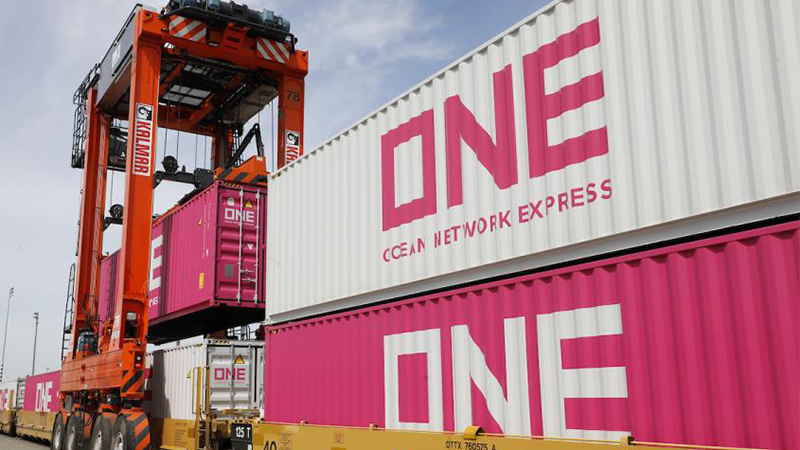
Cargo-handling equipment: |
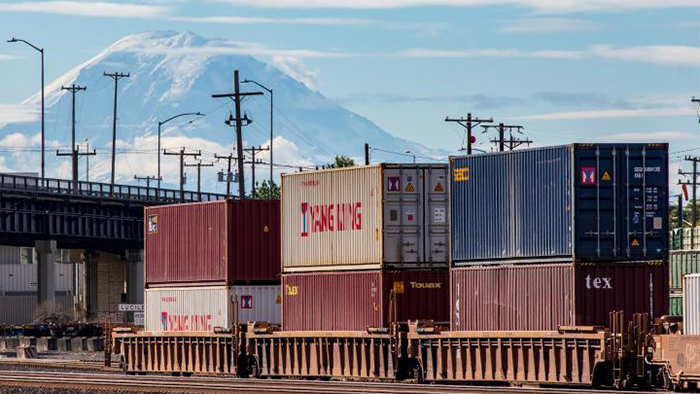
Rail locomotives: |
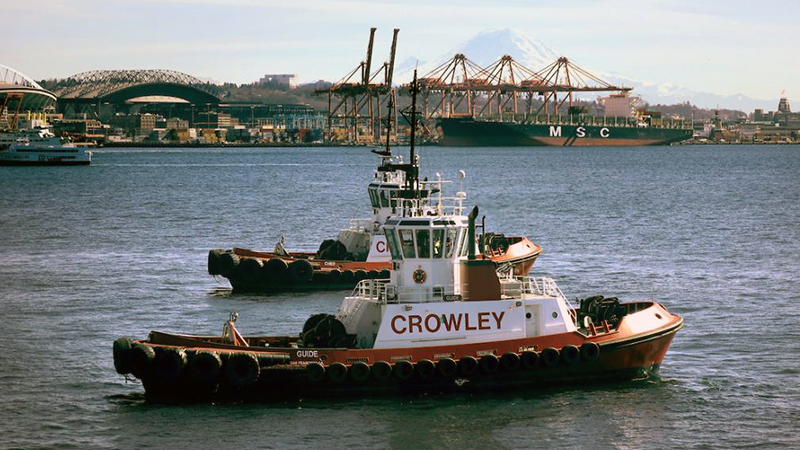
Commercial harbor vessels and recreational vessels: |

Fleet vehicles: |
How are maritime emissions measured?
Geographic boundary
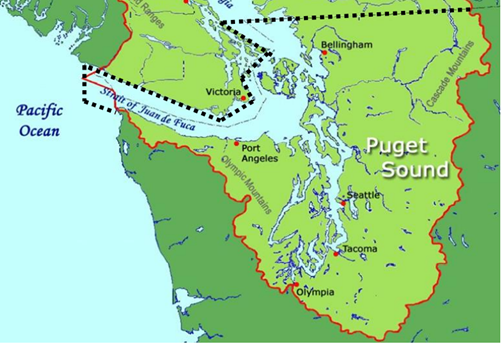
A first step to measuring emissions is to determine the geographic boundary. The Puget Sound Maritime Air Emissions Inventory measures emissions within a boundary determined by the local airshed. Airsheds are created by mountains and other topography confining or channeling air into a region and generally align with watersheds. Puget Sound-Georgia Basin Airshed extends north into British Columbia surrounding the watershed of the Strait of Georgia, and south to Olympia surrounding the watershed of the Puget Sound. Releasing pollutants into the air in one part of an airshed can impact air quality across the entire airshed, which is why Port of Seattle collaborates with Port of Tacoma, the Northwest Seaport Alliance, and Vancouver Fraser Port Authority on the Northwest Ports Clean Air Strategy. The geographic boundary of the Puget Sound Maritime Air Emissions Inventory is the U.S. portion of the Puget Sound-Georgia Basin Airshed. This area is bound by the Canadian border to the north, the Cascade Mountains to the east, the Olympic mountains to the west, and the Cascade foothills and Capital Peak to the south, as shown in Figure 1.
Modeling maritime emissions with real-world data
The Puget Sound Emissions Inventory is what is known as an “activity-based” emissions inventory. This means that emissions are calculated using a mathematical model and real world “activity data.” Each maritime-related source of emissions represents an activity and real data about characteristics of that activity, such as equipment engine size and hours of operation, vehicle miles traveled within the airshed, and vessel engine size, speed and distance traveled within the airshed, are collected and analyzed to estimate emissions. In some cases, the activity data are reported directly, such as an inventory of cargo handling equipment from a terminal operator. In other cases, the inventory relies on additional models, like travel demand models for truck trips, to estimate activity data.
The activity data is then multiplied by an emissions factor and a load factor to calculate emissions, generally following the formula below:
Emissions = Activity × Load Factor × Emission Factor
An emissions factor is a standard value that represents that amount of emissions that an activity for a given emissions source products. For example, the emissions factor for diesel fuel used in a truck is 10.21 kilograms of CO2 per gallon of diesel combusted. The emissions factor will be unique to the type of activity and type of pollutant. The load factor scales the activity based on intensity of operation.
The PSEI methodology is consistent with the U.S. Environmental Protection Agency’s (EPA) Port Emissions Inventory Guidance.
How is the Port improving maritime emissions data?
The 2021 PSEI will follow a similar methodology to previous inventories with a few key changes:
More localized data: As shown in Figure 1, the airshed boundary captures a large area. Some sources of maritime-related emissions, like cruise ships and container ships, travel long distances through the airshed to reach port terminals. Other sources of emissions are limited to one area, like cargo-handling equipment operating on a port terminal. When analyzing emission trends within the airshed, it can be difficult to pinpoint how those trends align with air quality experienced locally. With the next inventory, the project team has proposed changes to how the data is aggregated to analyze and communicate more location-specific information, such as emissions along major truck corridors and emissions at the county level for each port. These changes offer a more robust picture of levels and changes in port-related maritime emissions closer to where people live.
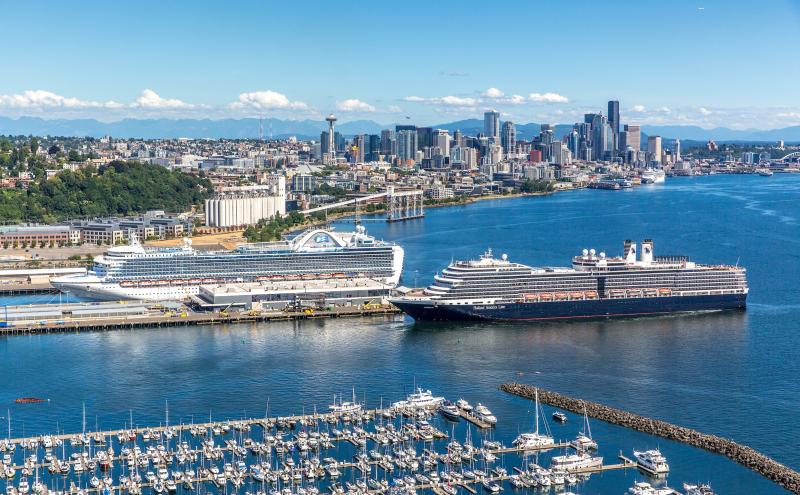
Emissions and COVID-19: 2021 was a tumultuous year for maritime industries. While the number of cruise ships, passengers, and cargo containers moving through port terminals can change year to year, supply chain disruptions and COVID-19 restrictions on cruise will have an exceptional impact on emission levels. For example, Port of Seattle had shortened cruise season in 2021 with 82 cruise calls from July through October, less than half of the cruise calls in cruise seasons prior to the onset of the pandemic.
Accessible data: We wouldn’t be surprised if you’ve never read the Puget Sound Maritime Emissions Inventory cover to cover before – it’s over 200 pages of information! While previous reports have been detailed, accurate, and comprehensive, the project team aims to produce a 2021 report that is accessible and digestible to a non-technical audience.
New tool
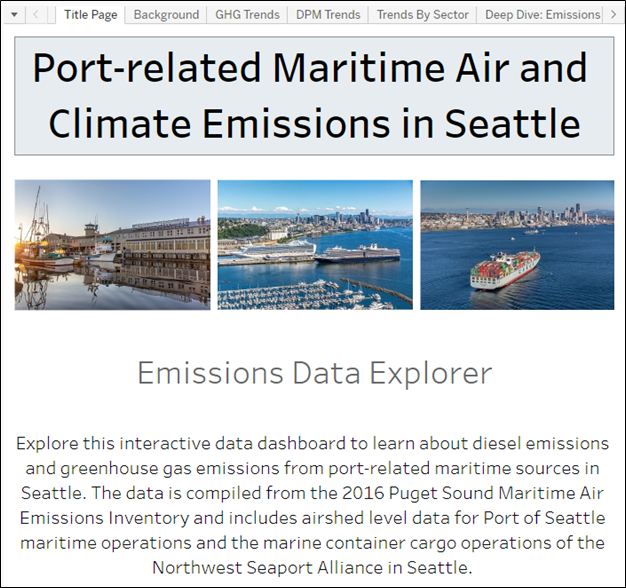
As a first step to improving data accessibility even before the updated results are available, we’ve launched a new Maritime Emissions Data Explorer Dashboard. This dashboard visualizes data from the 2016 Puget Sound Maritime Emissions Inventory in Tableau, and also includes data on cruise shore power use.
We want your feedback on the Maritime Emissions Data Explorer. Email us at [email protected] to share your thoughts and let us know which maritime-related emissions data and information you’re interested in.